Risk Metrics and Reporting
Metrics are one of the most important tools in the risk manager’s entire tool bag, because, out of all of the risk management tools, they are the one that is specifically designed to monitor things over time. Every other element (assessments, reports, etc.) always reflect a specific point in time.
The reporting workbook from ERM Advantage is built to support the most effective use of metrics to monitor risk profiles, and help management make informed decisions about any actions that may need to be taken to ensure risk levels remain within acceptable tolerance levels.

Common Challenges

Most organizations have some type of dashboard or scorecard, or perhaps track their metrics in a GRC solution. However, we consistently see the same problems that inevitably lead to metrics that fail to inform, are deeply lagging, and end up creating a lot of work for people with no value to the board and senior management.
- Metrics with no definition around type, purpose, source, scope, etc.
- No understand about why they matter only that they “can” be tracked
- Little to no definition of tolerance thresholds, or expected management actions
- Metrics that are marginally informative, often with little to no predictive value
- Reporting becomes just an obligatory exercise, not a living management tool
This tool helps solve those problems, providing a clear framework for identifying, documenting, analyzing, and reporting on key metrics.
The Metric Workbook from ERM Advantage comes with a series of worksheets that support effective metric use, documentation, and reporting. These worksheets are the same as those featured in the series of videos on risk metrics, notably Key Risk Indicators (and other types of metrics): Part 3.
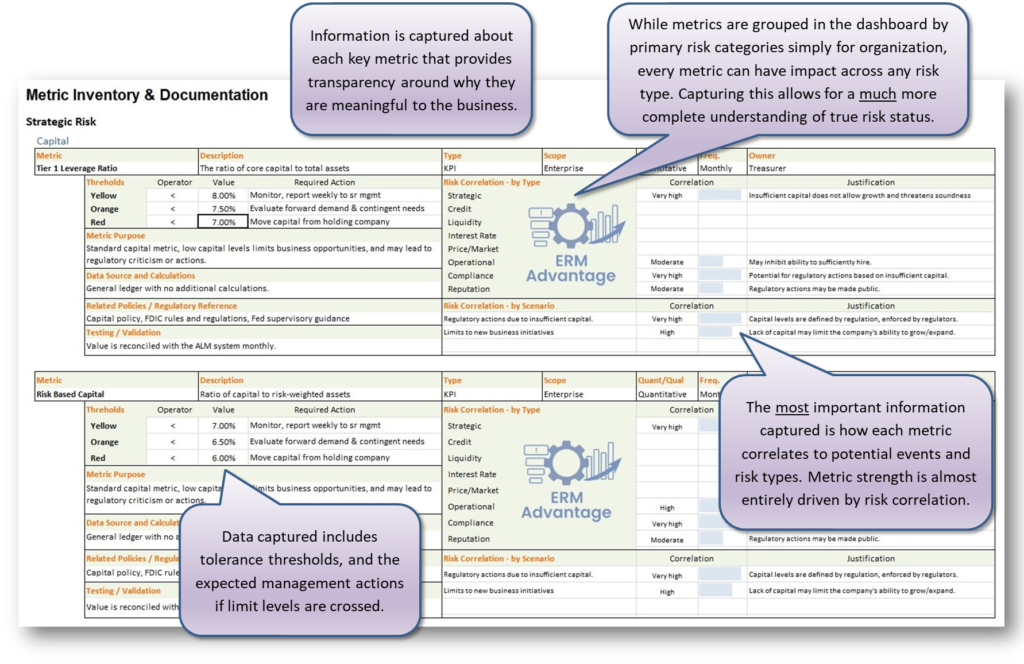
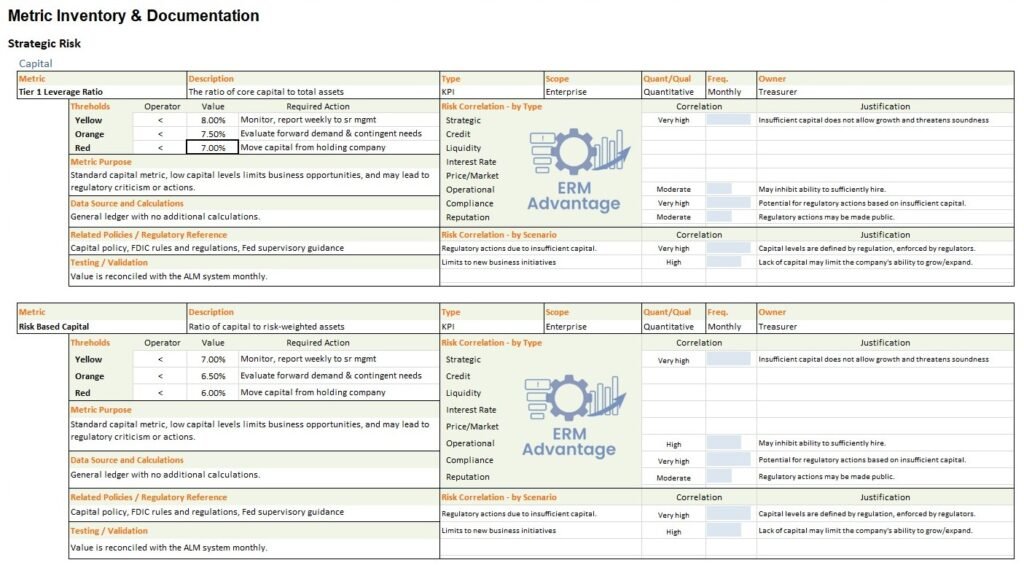
Metric Documentation Worksheet
One of the most important aspects of effectively using metrics starts with proper documentation. This not only provides a mechanism to understand and thoroughly evaluate metrics, but also ensures a consistent understanding as to why each metric matters, what it is telling us, and what is expected when tolerance thresholds are breached.
The metadata gathered here not only serves as a critical reference, but supports additional analysis and reporting throughout the workbook.
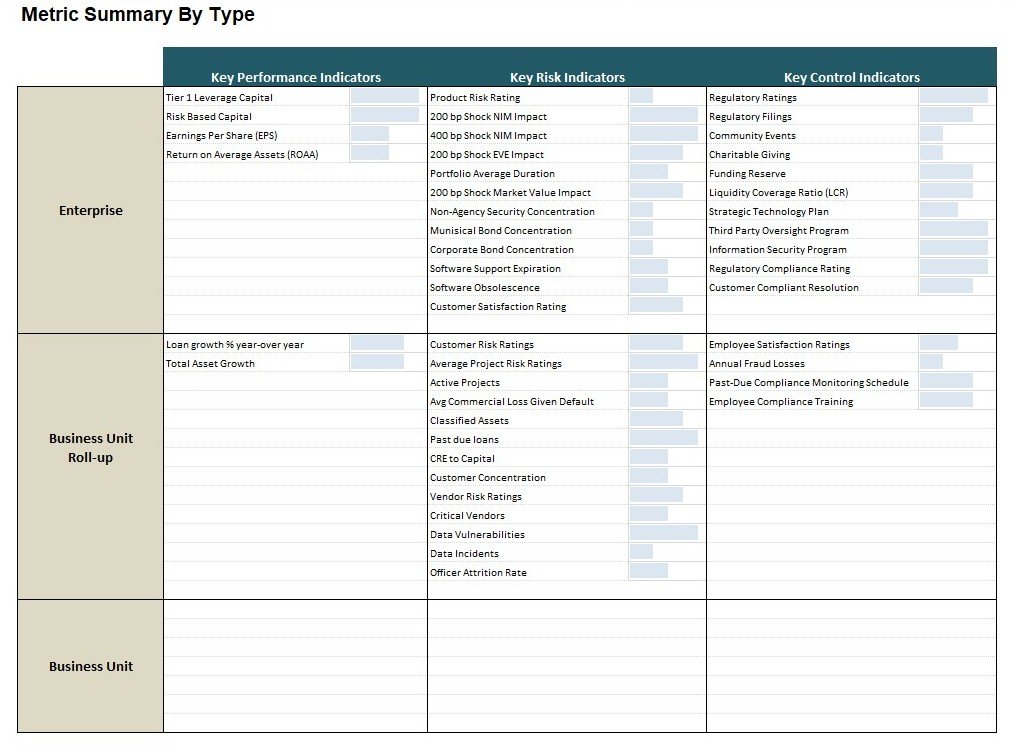
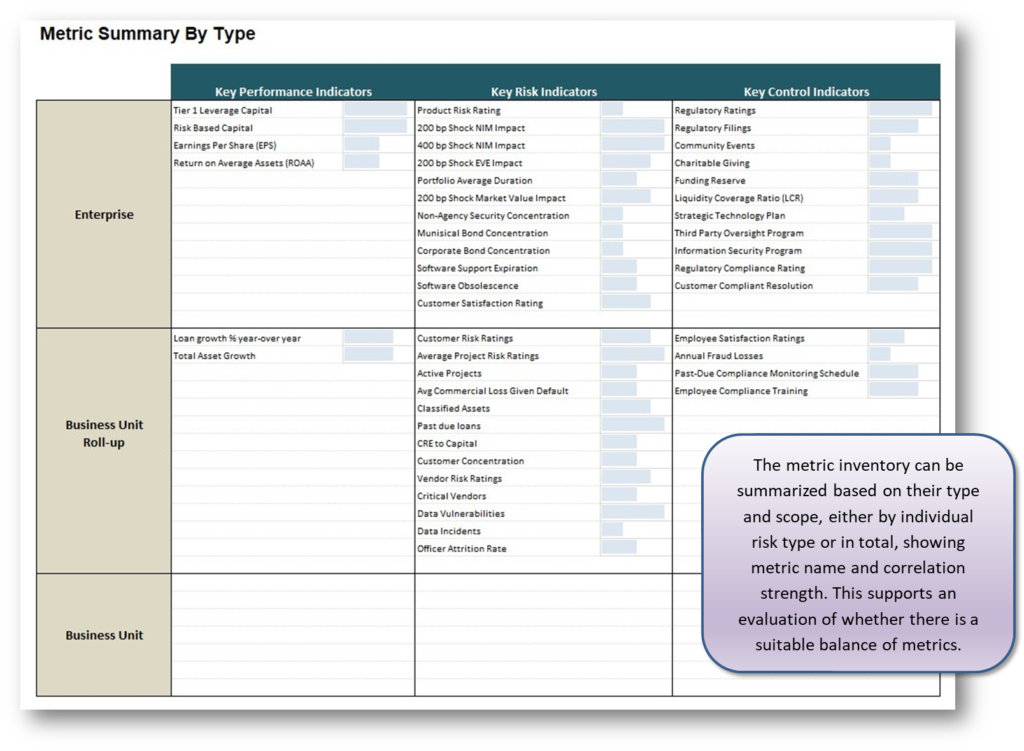
Metric Summary
One example of analysis supported by having proper metric documentation is the ability to evaluate the population of metrics based on their respective scope (department only, department roll-up, or enterprise) and type (KPI, KRI, or KCI). This can be shown for individual risk types or in aggregate.
This gives management the ability to evaluate whether risk areas are monitored using a balance of metrics covering performance, inherent risk, and risk treatments, and whether the metrics used are considered to have a high correlation to potential events. In other words, forward looking.
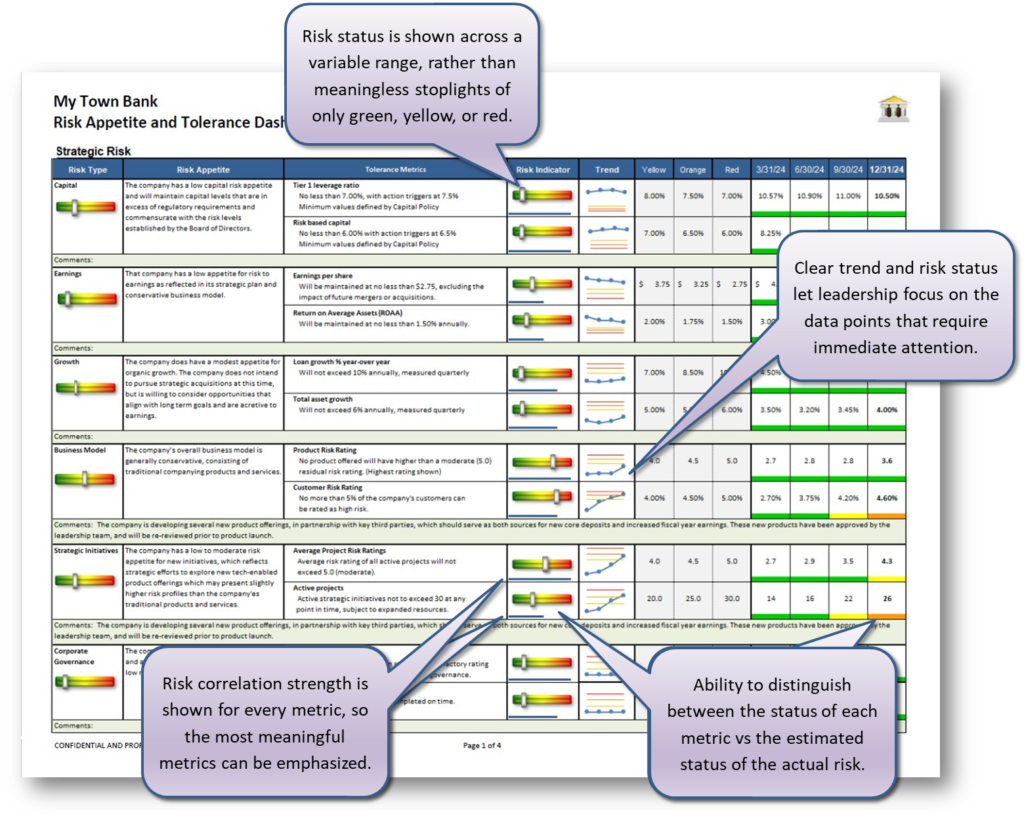
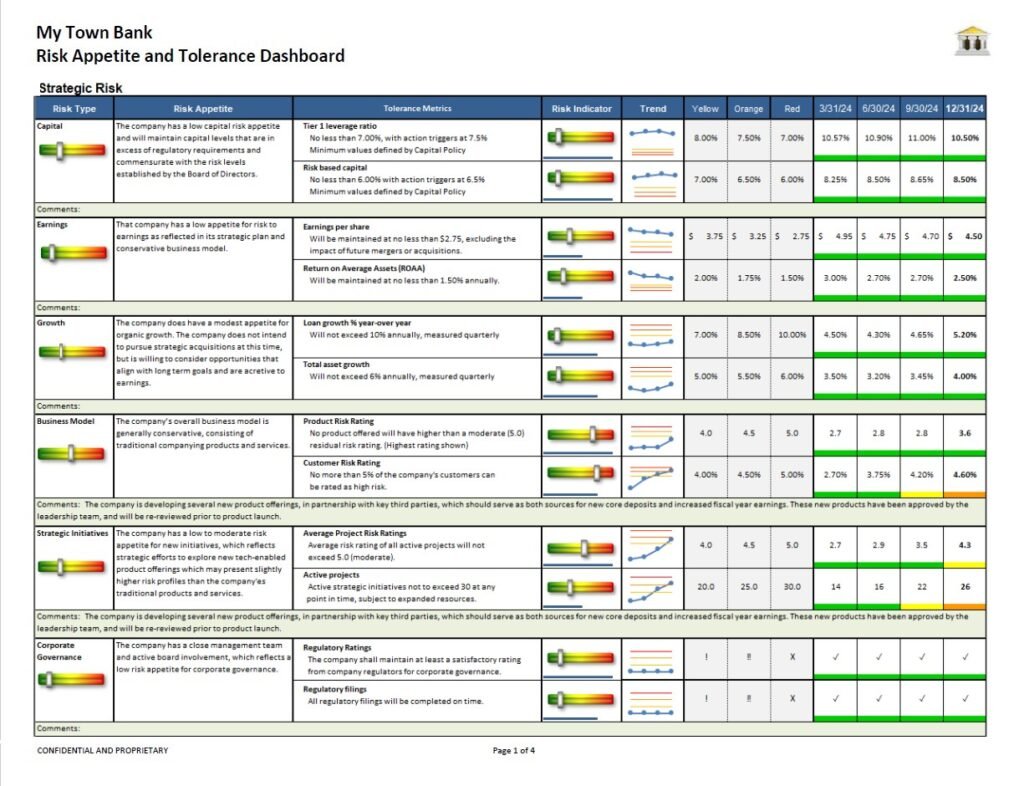
Reporting Dashboard
Ultimately, the purpose of metrics is to provide the board and senior leadership with a snapshot of risk status based on key indicators. While the included reporting dashboard can be modified in any way the company wishes, by default it includes a list of sample metrics, metric limits and multiple periods of example data, metric trends, and ultimately estimated risk status. Below each metric is also room for management commentary where warranted.
Included in the workbook are detailed instructions for updating information, including adding or removing metrics, and updating the related tables and reports. Everything the organization needs to effectively document, analyze, and report on key metrics is contained in one comprehensive workbook.
Additional worksheets include a listing by metric owner, an analysis tab which aggregates status from all metrics within each primary and secondary risk type, and a raw data table which can be used to analyze the population of metrics by any other dimension the company wishes to. New fields, tables, or reports can be added giving uses infinite flexibility in how they capture, analyze and report on key metrics within the organization.
Key Benefits of the ERM Advantage Risk Metric Workbook
- The most comprehensive metric documentation and reporting tool on the market
- A reporting dashboard/scorecard that focuses on the most meaningful, actionable information
- Presents a complete understanding of what each metrics means and why it matters
- Helps determine if a balanced portfolio of metrics is being used
- All information can ultimately be imported into a GRC tool
All orders include completed examples, recommended procedures for using the templates, a basic project plan where appropriate, and an overview of the overall ERM Advantage framework for reference. Email support is available for questions, with options for live advisory services or support.
Risk Metric Workbook
Includes:
- All metric worksheets with examples included
- Update instructions and procedures
- Recommended project plan to populate or refresh
- Includes a 1-hour Zoom call to review the templates
Price: $ 2,500
To order this workbook, or if we can answer any questions, please use the Contact Us form.